Usage#
Understanding the Basics#
This video will guide you through the basics of using the Formula Builder, PivotTables, and creating charts.
For a step-by-step guide to using the add-in’s features, please see the documentation below.
Creating Formulas#
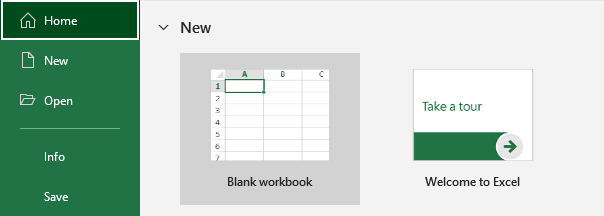
Open Excel and create a new workbook or open an existing one.
Click on the Formulas tab in the ribbon menu at the top of the screen.

Click on the Insert Functions button to open a dialog box.

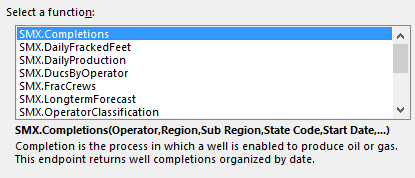
In the Or select a category section, scroll down to find the “SMX” category.
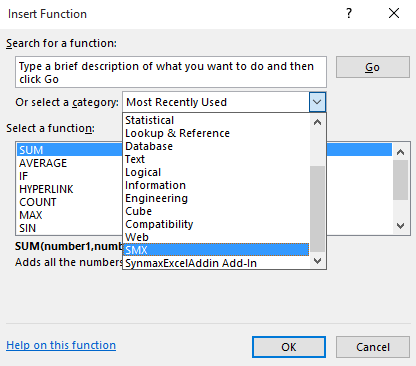
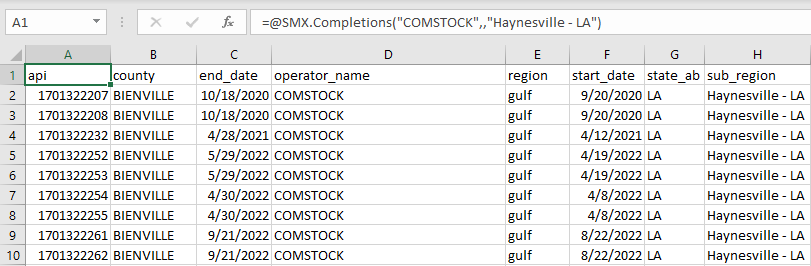
Select the function you want to use from the list of functions in the Select a function section, for example, SMX.Completions.
Click OK to open the Function Arguments dialog box.

In the Function Arguments dialog box, you can see the name of the function and the arguments it takes.
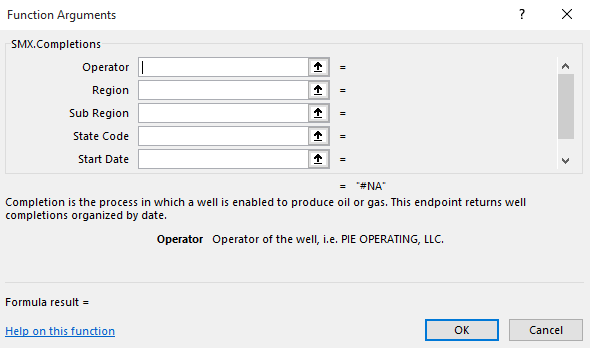
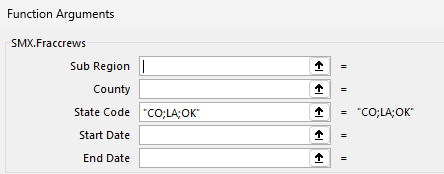
Enter the values for the arguments you want to use in the Value column next to each argument. Multiple options are supported.
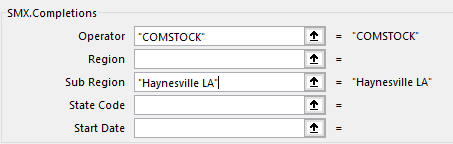
To provide multiple values, separate values with a semicolon (“;”)…
Click OK to close the Function Arguments dialog box and return to the worksheet.
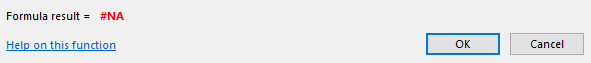
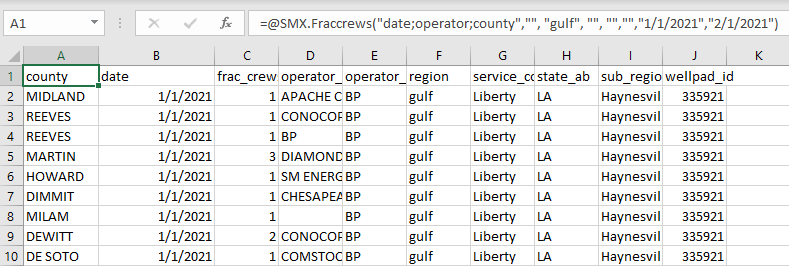
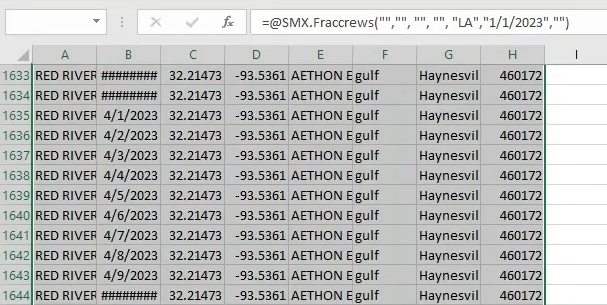
The result of the function will appear in the cell where you entered the function formula.
You can use this same process to enter the arguments for any of the SynMax add-in functions that require arguments. Using the Function Arguments feature in Excel can make it easier to enter complex formulas and ensure that you are entering the correct values for each argument.
Creating PivotTables#
Select the data you want to display as a PivotTable. To select all rows and columns in the sheet, press ctrl + a.
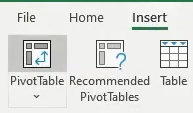
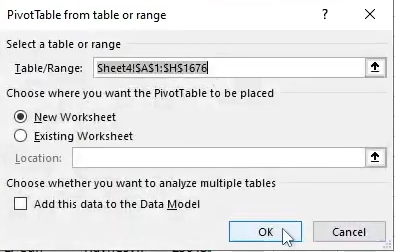
Under the Insert menu in the ribbon menu, click on PivotTable.
Click on OK to create a PivotTable with the default settings.
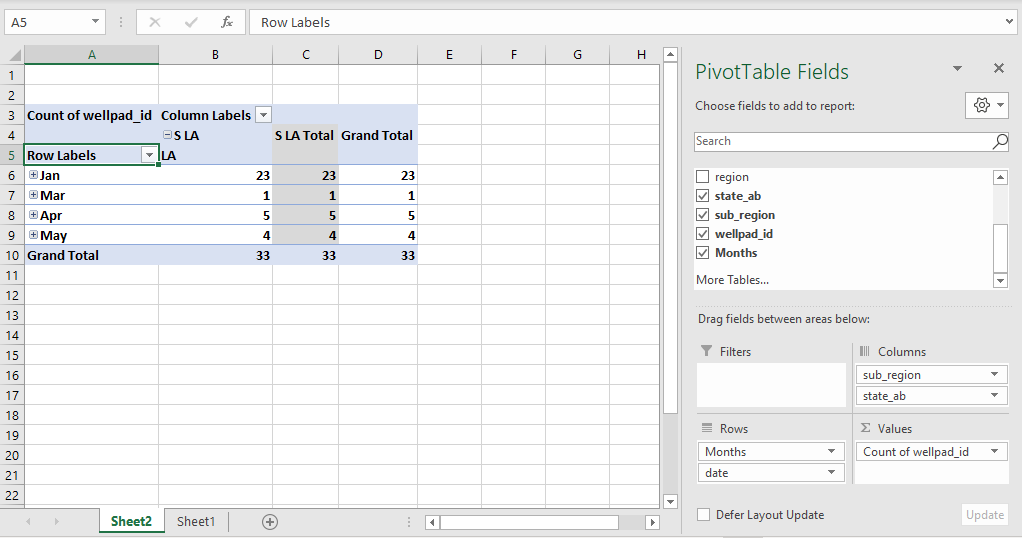
Once you have created a PivotTable, you can use the PivotTable Fields pane to add and remove fields in Rows, Columns, Filters, and Values views.
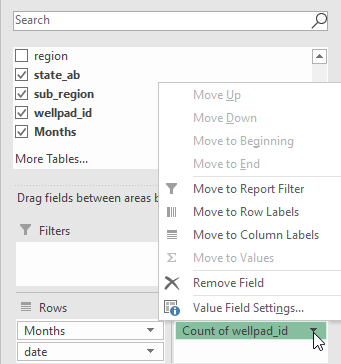
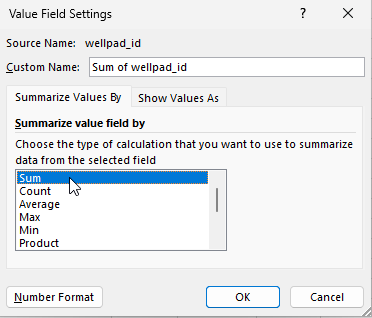
Click on the arrow next to the field name and click on Value Field Settings to summarize the field by a different type of calculation.
Note
To learn more about PivotTables, please see the Microsoft 365 support page.
Creating Charts#
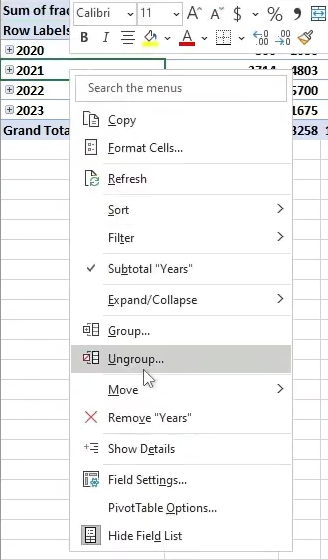
In the PivotTable you just created, ungroup the data you want to visualize.
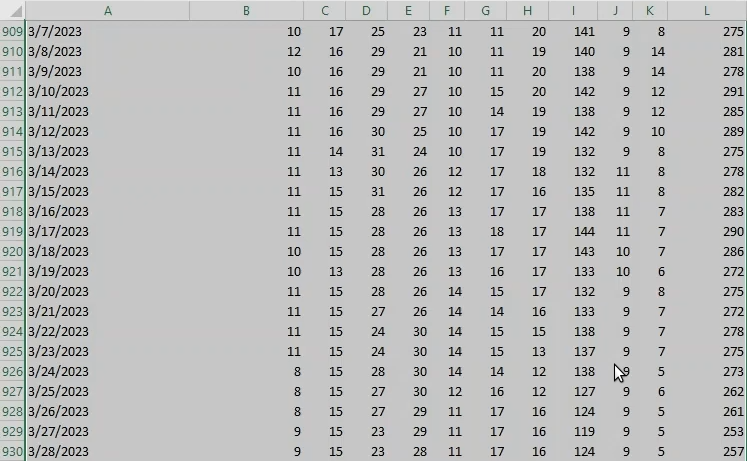
Select the data.
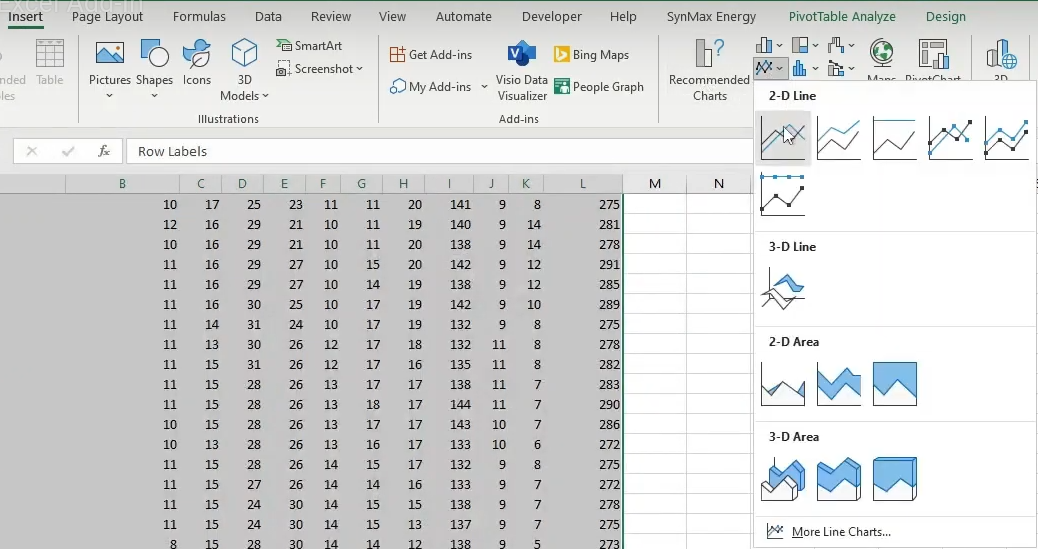
Under the Insert tab in the ribbon menu, click on the type of chart you want to plot. Hovering on chart icons provides a preview.
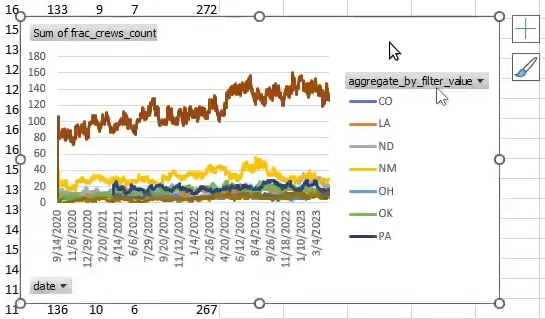
Here is an example of a 2-D line plot:
Note
To learn more about charts, please see the Microsoft 365 support page.
Advanced Features#
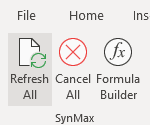
Refresh All: Runs the last used formula again.
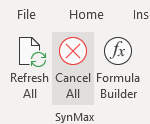
Cancel All: Cancel any running requests or calculations in the workbook. This is useful if you notice an error in your data or formulas and want to stop the calculation process to avoid incorrect results or unnecessary processing time.
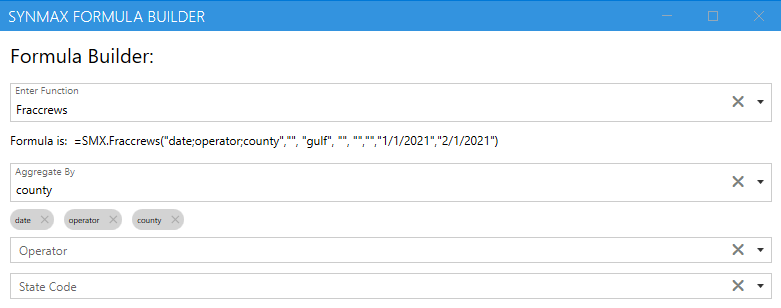
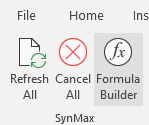
Formula Builder: Simplifies the process of creating and editing formulas in Excel. It provides a user-friendly interface with a searchable list of available functions, along with their descriptions and syntax.
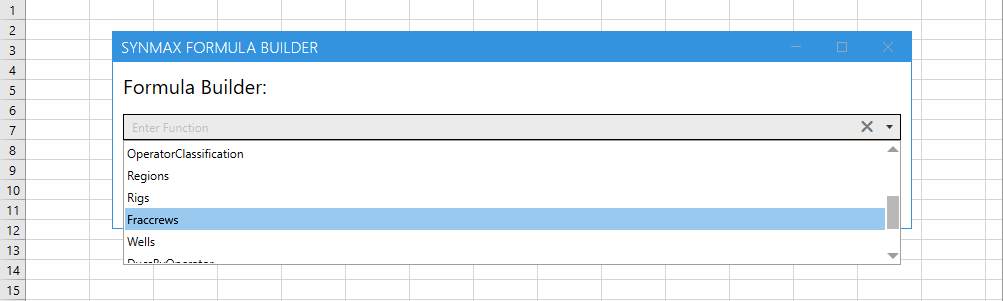
Using the Formula Builder#
Click on the Formula Builder button to open the tool.
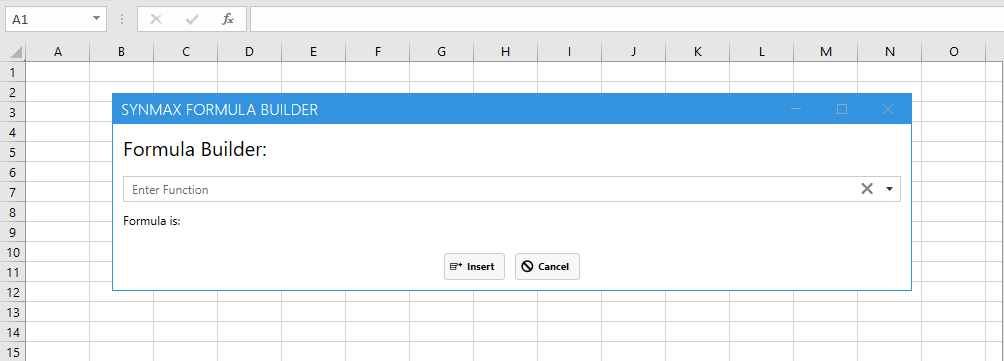
Select your desired function from the dropdown menu.
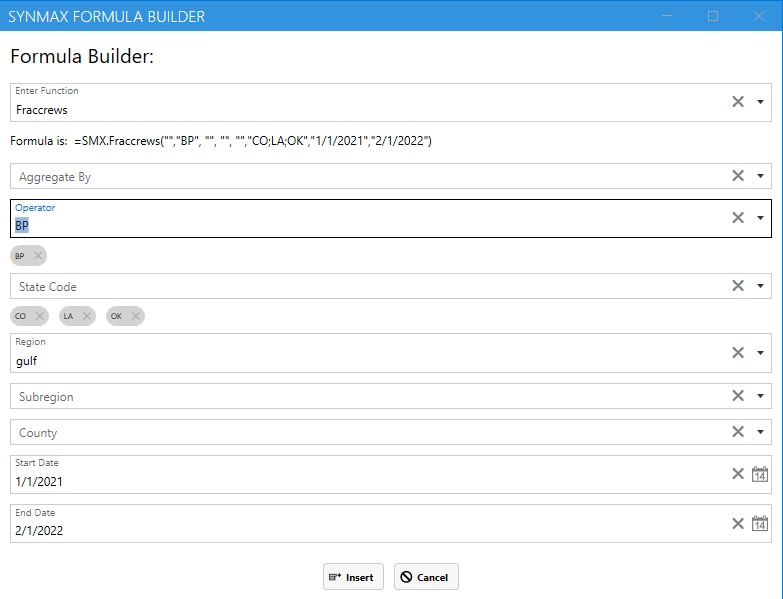
Input any argument values for the chosen function. Multiple options may be specified.
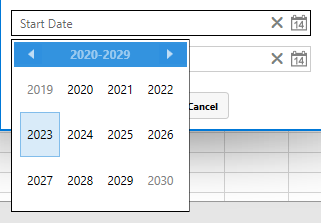
To quickly add dates, click on the calendar icon on the right side of the date input boxes.
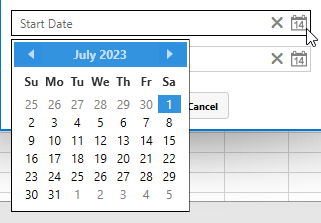
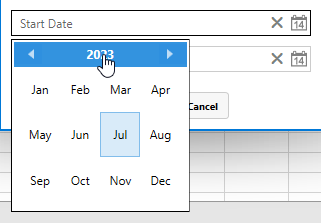
To change the view from days to months to years, click on the blue bar at the top of the calendar.
Click on the OK button to close the Formula Builder.
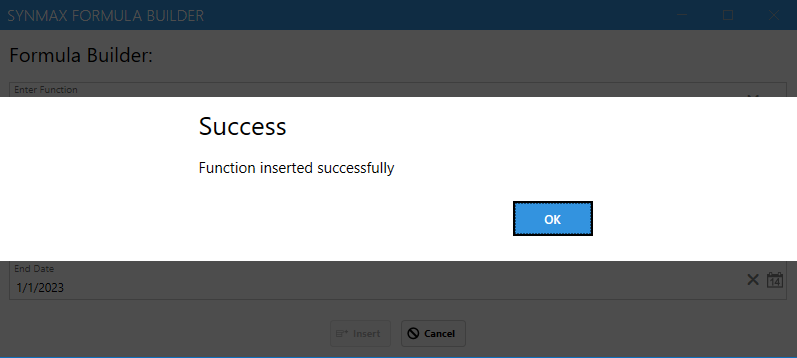
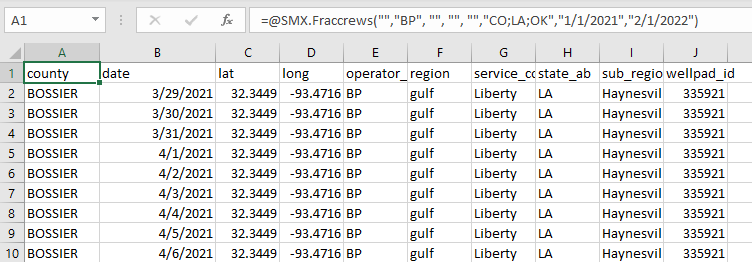
The result of the function will now be displayed in the sheet.
Using Aggregation#
The Aggregate By column in the Formula Builder can be used as a pivoting tool that can group data based on the desired parameter. Aggregating by multiple parameters is also supported.