ShortTermForecastAggregatedHistory#
This function returns historic versions of the ShortTermForecasts on a sub-region aggregated level.
The sub-region aggregated data is more tractable for higher level analysis in comparison to the more detailed and much larger well-level ShortTermForecastHistory dataset.
Note
This function offers sub-region aggregated versions of all historical SynMax ShortTermForecasts going back in three days increments until 2021-01-15.
Each version of the ShortTermForecast can be uniquely identified by the forecast_run_date.
Incomplete state data is accounted for in our forecasts. For example, if state data is incomplete for a month prior to the
start_date, we fill in the missing data before each forecasting.Production numbers are reported on a dry basis.
Syntax#
- =SMX.ShortTermForecastAggregatedHistory(Sub Region, Start Date, End Date, Forecast Run Date)
Arguments#
Parameter |
Description |
Example |
|---|---|---|
forecast_run_date |
Date of nearest forecast (unsynced). Date formatting - [“YYYY-MM-DD”] |
|
Subregion |
Limit search by the name of the subregion where the wells are located. |
|
Start Date |
Limit search to a start date [“YYYY-MM-DD”]. |
|
End Date |
Limit search to an end date [“YYYY-MM-DD”]. |
|
Data can be aggregated by: sub_region, date, forecast_run_date
Note
Performance considerations: This function may take some time to retrieve and organize large amounts of data. For best performance, it is recommended to limit the number of input parameters and retrieve only the data needed for analysis.
Note
No Data: Output data will return “#No Data” when input data is invalid or does not exist.

Examples#
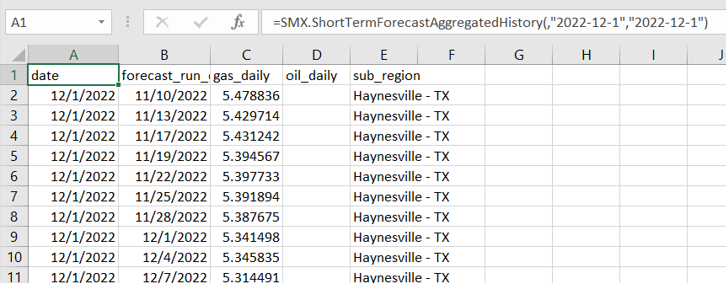
Get a short-term forecast aggregated history for a specific date:
=SMX.ShortTermForecastAggregatedHistory(,"2022-12-01","2022-12-01")
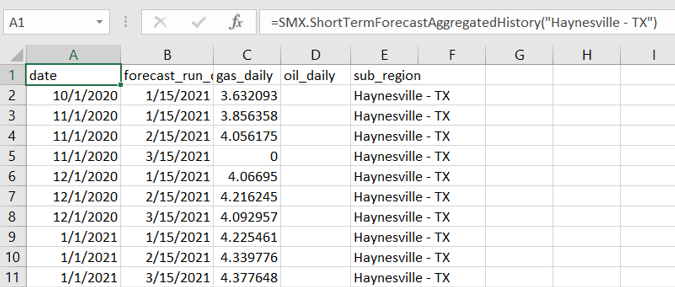
Get short-term forecast aggregated history for a specific subregion:
=SMX.ShortTermForecastAggregatedHistory("Haynesville - TX")
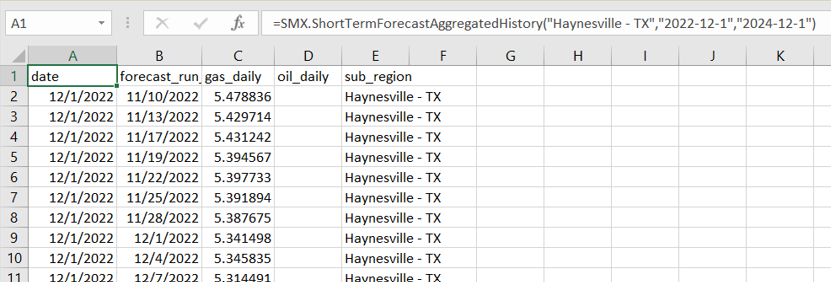
Get short-term forecast aggregated history for a specific subregion during a specific timeframe:
=SMX.ShortTermForecastAggregatedHistory("Haynesville - TX","2022-12-1","2024-12-1")
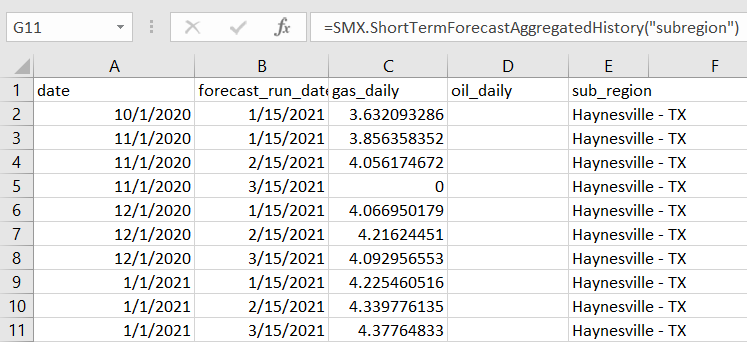
Get short-term forecast aggregated by subregion:
=SMX.ShortTermForecastAggregatedHistory("subregion")
Output Parameters#
Field |
Type |
Description |
Example |
|---|---|---|---|
date |
string |
Date selected for forecast (unsynced). Date formatting - [“YYYY-MM-DD”] |
“2022-11-01” |
forecast_run_date |
string |
Date of nearest forecast (unsynced). Date formatting - [“YYYY-MM-DD”] |
“2022-06-01” |
gas_daily |
float |
Average rate of gas production expressed per day (in BCF/day). |
23.842 |
oil_daily |
float |
The amount of oil produced in a single day (in BBLS, or barrels). |
112.9570761 |
sub_region |
string |
Aggregation of several counties, typically representing a major producing basin. |
“S LA” |
Note
Unsynced data in the date column provides a date at the start of the month. However, the actual reported date is for the end of the month.
For example, if the reported date is “2022-1-10”, this means the data pertains to the month of January and was actually reported on “2022-01-31”.
This means that you should ideally interpret the reported date as representing the whole month, not just the specific date at the start of the month.
Errors#
Functions may return the following error messages:
Error |
Description |
|---|---|
#VALUE! |
Input parameters are invalid or cannot be parsed. |
#REF! |
The function cannot retrieve data from the SynMaxax API due to a network or connectivity issue. |
!!! EXCEPTION |
Invalid input parameters. Make sure dates are enclosed in quotes. Check if the API key is valid. To know more about how to use an API key, please check the section on authentication. |
#No Data |
Input data is invalid or does not exist. |
Note
You can also check the logs for more information on errors. You can access the logs by clicking on SynMax Energy on the Excel ribbon and then clicking on Logs.