PipelineScrapes#
This endpoint provides daily updates on various aspects of pipeline activity, focusing on gas production. It offers detailed information about pipeline production in various regions, with a focus on specific locations and pipeline entities.
This endpoint is particularly useful for tracking energy production, monitoring pipeline activities, and analyzing regional energy trends.
Syntax#
- =SMX.PipelineScrapes(Category, Region, Subregion, County, State Code)
Arguments#
Parameter |
Description |
Example |
|---|---|---|
Category |
Limit search to a type of flow point as described by the pipelines informational posting location data disclosure. |
|
Region |
Limit search by the name of the region where the wells are located. |
|
Subregion |
Limit search by the name of the subregion where the wells are located. |
|
County |
Limit search by county where the well is located. |
|
State Code |
Limit search by the state code where the wells are located. |
|
Note
Performance considerations: This function may take some time to retrieve and organize large amounts of data. For best performance, it is recommended to limit the number of input parameters and retrieve only the data needed for analysis.
Note
No Data: Output data will return “#No Data” when input data is invalid or does not exist.

Example#
To retrieve production in a specific subregion:
=SMX.PipelineScrapes("","","Central - TX","","","","")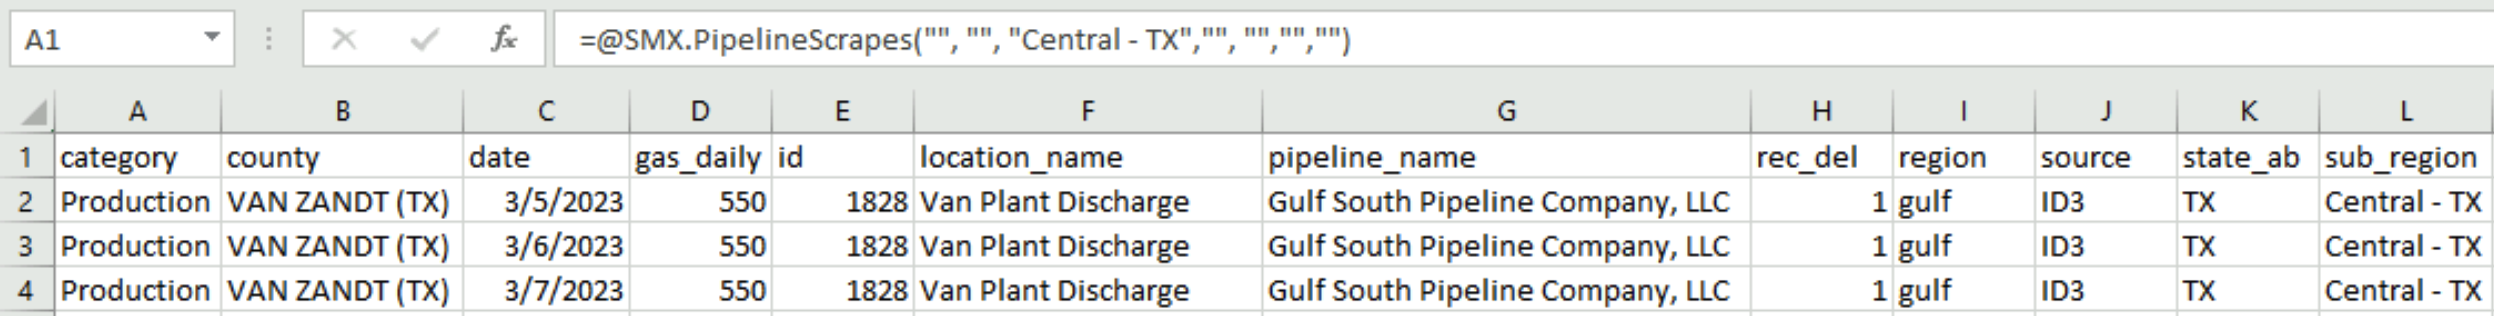
Output Parameters#
Field |
Type |
Description |
Example |
|---|---|---|---|
category |
string |
Limit search to a type of flow point as described by the pipelines informational posting location data disclosure. |
“Production” |
county |
string |
County in the state where the well is located. |
“BEAUREGARD” |
date |
string |
Date of observation. Date formatting - [“YYYY-MM-DD”] |
“2022-06-01” |
gas_daily |
float |
Average rate of gas production expressed per day (in BCF/day). |
23.842 |
id |
integer |
A SynMax assigned unique ID for each flow point. |
1 |
location_name |
string |
Name of the flow point as provided by the pipeline’s information posting disclosure. |
“TIOGA” |
pipeline_name |
string |
Name of pipeline as provided by FERC. |
“Alliance Pipeline L.P.” |
rec_del |
integer |
Represents Receipt or Delivery Point. |
1 |
region |
string |
Aggregation of multiple major producing basins. |
“GULF” |
source |
string |
Indicates the origin or method of data collection for the pipeline information provided by the API. Returned values are either “scrape” for webscraped values, “ffill” for forward filled values. |
“scrape” |
state_ab |
string |
Abbreviation of the state. |
“LA” |
sub_region |
string |
Aggregation of several counties, typically representing a major producing basin. |
“S LA” |
Errors#
Functions may return the following error messages:
Error |
Description |
|---|---|
#VALUE! |
Input parameters are invalid or cannot be parsed. |
#REF! |
The function cannot retrieve data from the SynMaxax API due to a network or connectivity issue. |
!!! EXCEPTION |
Invalid input parameters. Make sure dates are enclosed in quotes. Check if the API key is valid. To know more about how to use an API key, please check the section on authentication. |
#No Data |
Input data is invalid or does not exist. |
Note
You can also check the logs for more information on errors. You can access the logs by clicking on SynMax Energy on the Excel ribbon and then clicking on Logs.