ShortTermForecastDeclines#
This function returns short-term forecasts of oil and gas production declines for individual well APIs. It extends the functionality of the short-term forecast by projecting the “well-level” forecast up to ten years into the future from the current date.
Syntax#
- =SMX.ShortTermForecastDeclines(Aggregated By, Operator, Region, Sub Region, County)
Arguments#
Parameter |
Description |
Example |
|---|---|---|
aggregated_by |
Aggregate data by a list of parameters. |
|
Operator |
Limit search by the name of the operator whose wells to retrieve. |
|
Region |
Limit search by the name of the region where the wells are located. |
|
Subregion |
Limit search by the name of the subregion where the wells are located. |
|
County |
Limit search by county where the well is located. |
|
Data can be aggregated by: county, date, first_production_month, modeled, operator, production_month, region, state_code, sub_region.
Note
Performance considerations: This function may take some time to retrieve and organize large amounts of data. For best performance, it is recommended to limit the number of input parameters and retrieve only the data needed for analysis.
Note
No Data: Output data will return “#No Data” when input data is invalid or does not exist.

Examples#
Get short-term forecast declines for a specific date:
=SMX.ShorttermForecastDeclines(,,,,,,,"2021-5-1","2021-5-1")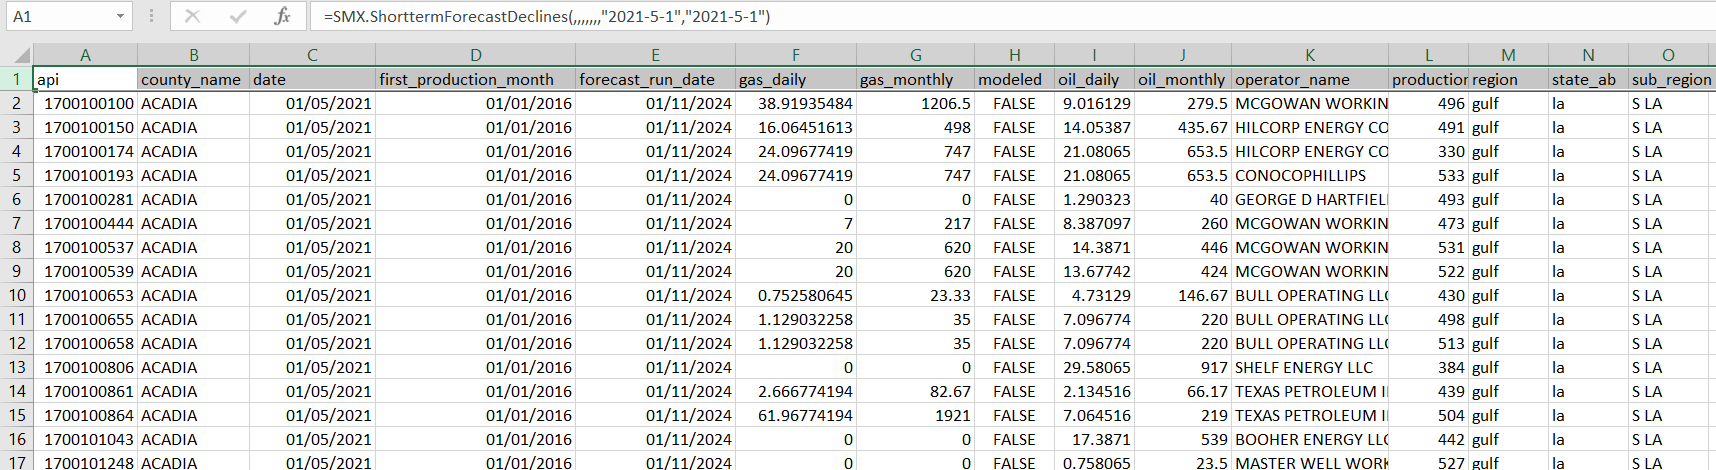
Get short-term forecast declines for a specific subregion and county:
=SMX.ShorttermForecastDeclines(,,,"Haynesville - TX","SAN AUGUSTINE")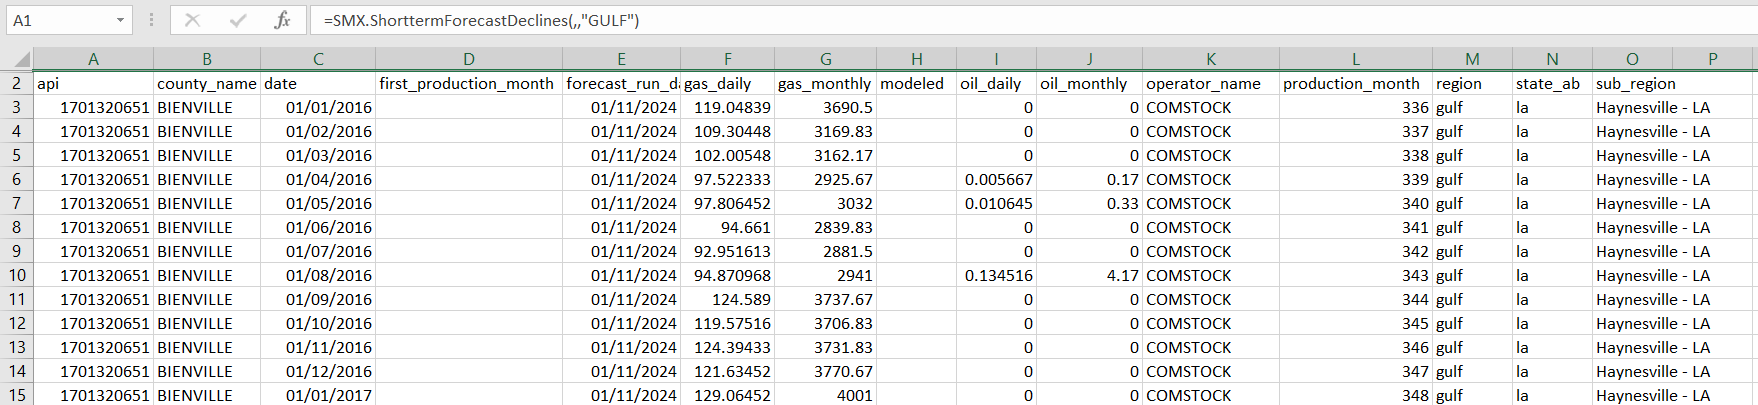
Get short-term forecast declines for a specific operator during a specific timeframe
=SMX.ShorttermForecastDeclines(,"CONOCOPHILLIPS","GULF",,,,,"05-01-2021","05-03-2023")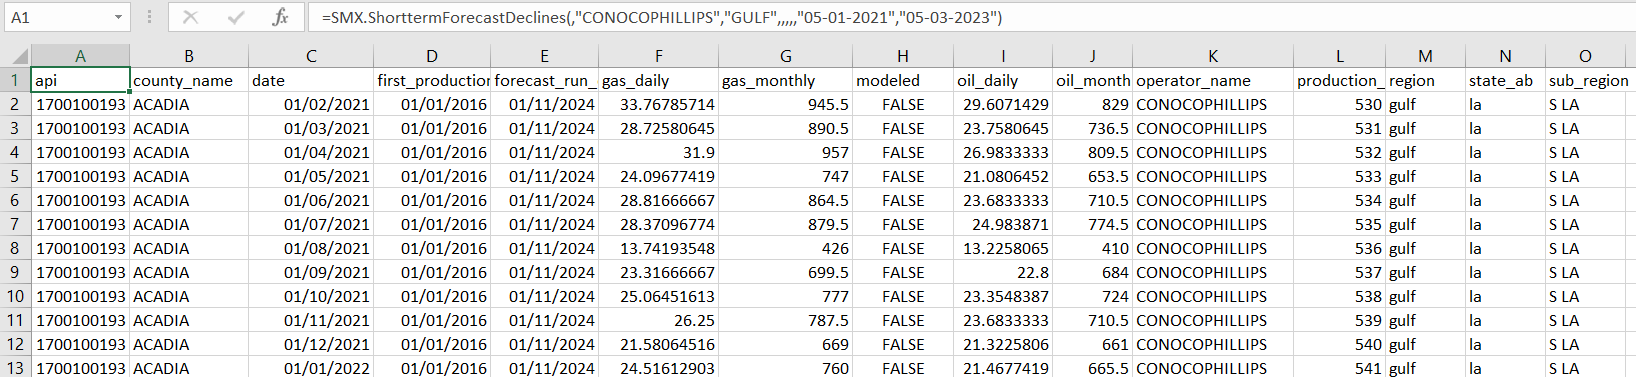
Get short-term forecast declines aggregated by region:
=SMX.ShortTermForecastDeclines("region")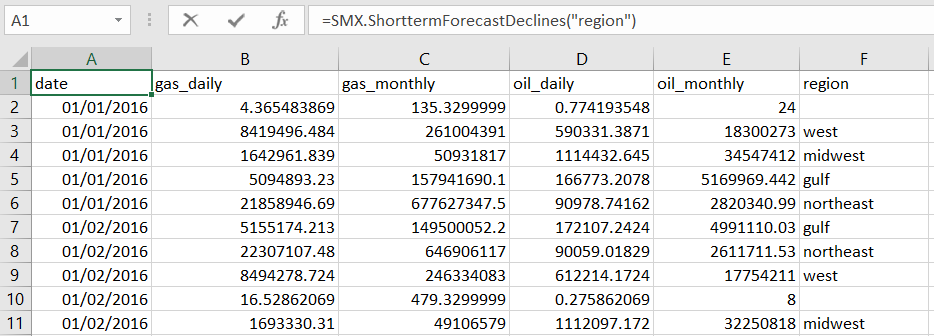
Output Parameters#
Field |
Type |
Description |
Example |
|---|---|---|---|
api |
integer |
An API is a unique, permanent, numeric identifier assigned to each well drilled. |
1701121257 |
county_name |
string |
County in the state where the well is located. |
“BEAUREGARD” |
date |
string |
Date selected for forecast (unsynced). Date formatting - [“YYYY-MM-DD”] |
“2022-11-01” |
first_production_month |
string [“YYYY-MM-DD”] |
Start of date range for selecting wells that started producing in the specific month. Format: Format: “YYYY-MM-01” |
“2009-10-01” |
forecast_run_date |
string |
Date of forecast generation (unsynced). Date formatting - [“YYYY-MM-DD”] |
“2022-11-01” |
gas_daily |
float |
Average rate of wet gas production expressed per day (in BCF/day). |
23.842 |
gas_monthly |
float |
Amount of wet gas produced over one month (in MMCF, or 1 million cubic feet). |
98801.0 |
modeled |
boolean |
Indicates whether the production numbers are from the forecast model (True) or from pipescrapes (False). |
True, False |
oil_daily |
float |
The amount of oil produced in a single day (in BBLS, or barrels). |
112.9570761 |
oil_monthly |
float |
The amount of oil produced over one month (in BBLS, or barrels). |
279.5 |
operator_name |
string |
Operator of the well. |
“PIE OPERATING, LLC” |
production_month |
integer |
The production month to retrieve completions for. Defaults to the latest month available if not specified. |
496 |
region |
string |
Aggregation of multiple major producing basins. |
“GULF” |
state_ab |
string |
Abbreviation of the state. |
“LA” |
state_reported |
boolean |
Indicates whether the data is sourced from state-reported records. |
TRUE |
sub_region |
string |
Aggregation of several counties, typically representing a major producing basin. |
“S LA” |
Note
Unsynced data in the date column provides a date at the start of the month. However, the actual reported date is for the end of the month.
For example, if the reported date is “2022-1-10”, this means the data pertains to the month of January and was actually reported on “2022-01-31”.
This means that you should ideally interpret the reported date as representing the whole month, not just the specific date at the start of the month.
Errors#
Functions may return the following error messages:
Error |
Description |
|---|---|
#VALUE! |
Input parameters are invalid or cannot be parsed. |
#REF! |
The function cannot retrieve data from the SynMaxax API due to a network or connectivity issue. |
!!! EXCEPTION |
Invalid input parameters. Make sure dates are enclosed in quotes. Check if the API key is valid. To know more about how to use an API key, please check the section on authentication. |
#No Data |
Input data is invalid or does not exist. |
Note
You can also check the logs for more information on errors. You can access the logs by clicking on SynMax Energy on the Excel ribbon and then clicking on Logs.