ProductionByWell#
This endpoint returns monthly oil and gas production figures for a specific well. Oil production and gas production volumes are displayed in BBLS (barrels) and MMCF (1 million cubic feet) respectively.
Syntax#
- =SMX.ProductionByWell(Aggregate By, Operator, Region, Subregion, County)
Arguments#
Parameter |
Description |
Example |
|---|---|---|
Aggregate By |
Specifies a parameter by which to aggregate data. |
|
Operator |
Limit search by the name of the operator whose wells to retrieve. |
|
Region |
Limit search by the name of the region where the wells are located. |
|
Subregion |
Limit search by the name of the subregion where the wells are located. |
|
County |
Limit search by county where the well is located. |
|
Data can be aggregated by: county, date, operator, region, state_code, sub_region.
Note
Performance considerations: This function may take some time to retrieve and organize large amounts of data. For best performance, it is recommended to limit the number of input parameters and retrieve only the data needed for analysis.
Note
No Data: Output data will return “#No Data” when input data is invalid or does not exist.

Examples#
To retrieve production by a specific operator in a specific region:
=SMX.ProductionByWell(,"INACTIVE OPERATOR", "gulf")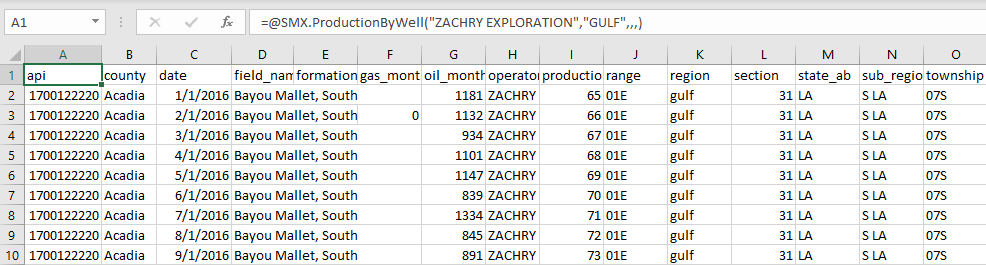
To retrieve production in a specific subregion and county for a specific date:
=SMX.ProductionByWell("date",,,"S LA","ACADIA")
To retrieve production with a specific operator and county:
=SMX.ProductionByWell(,"ZACHARY EXPLORATION",,"S LA",,,"2021-6-1","2022-6-1")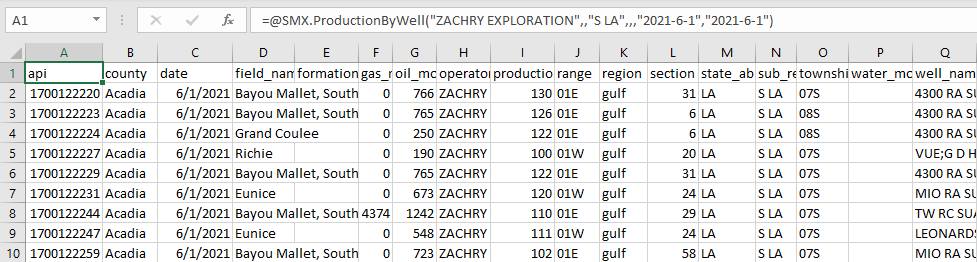
To retrieve production aggregated by date:
=SMX.ProductionByWell("date")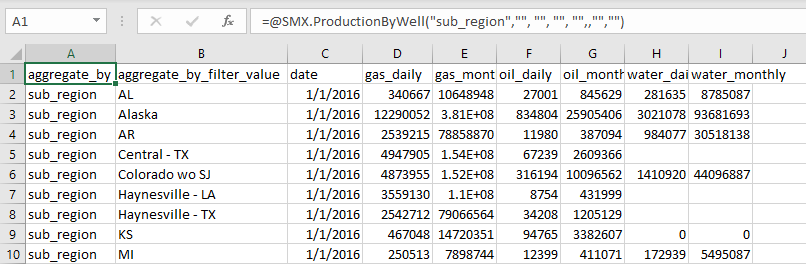
Output Parameters#
Field |
Type |
Description |
Example |
|---|---|---|---|
date |
string |
Unsynced date on which oil and gas production starts. Date formatting - [“YYYY-MM-DD”] |
“2022-06-01” |
gas_daily |
float |
Average rate of wet gas production expressed per day (in BCF/day). |
23.842 |
gas_monthly |
float |
Amount of wet gas produced over one month (in MMCF, or 1 million cubic feet). |
98801.0 |
oil_daily |
float |
The amount of oil produced in a single day (in BBLS, or barrels). |
112.9570761 |
oil_monthly |
float |
The amount of oil produced over one month (in BBLS, or barrels). |
279.5 |
sub_region |
string |
Aggregation of several counties, typically representing a major producing basin. |
“S LA” |
water_daily |
float |
The amount of water extracted from the well during a single day (in BBLs, or barrels). |
23.296827 |
water_monthly |
integer |
The amount of water extracted from the well during a one-month production period (in BBLs, or barrels). |
947 |
Note
Unsynced data in the date column provides a date at the start of the month. However, the actual reported date is for the end of the month.
For example, if the reported date is “2022-1-10”, this means the data pertains to the month of January and was actually reported on “2022-01-31”.
This means that you should ideally interpret the reported date as representing the whole month, not just the specific date at the start of the month.
Errors#
Functions may return the following error messages:
Error |
Description |
|---|---|
#VALUE! |
Input parameters are invalid or cannot be parsed. |
#REF! |
The function cannot retrieve data from the SynMaxax API due to a network or connectivity issue. |
!!! EXCEPTION |
Invalid input parameters. Make sure dates are enclosed in quotes. Check if the API key is valid. To know more about how to use an API key, please check the section on authentication. |
#No Data |
Input data is invalid or does not exist. |
Note
You can also check the logs for more information on errors. You can access the logs by clicking on SynMax Energy on the Excel ribbon and then clicking on Logs.