Simulation Builder - Flat Production#
4. Flat Production#
The Flat Production determines the necessary inputs (e.g., number of wells of frac crews) to achieve future production equal to recent production level.
Steps to run#
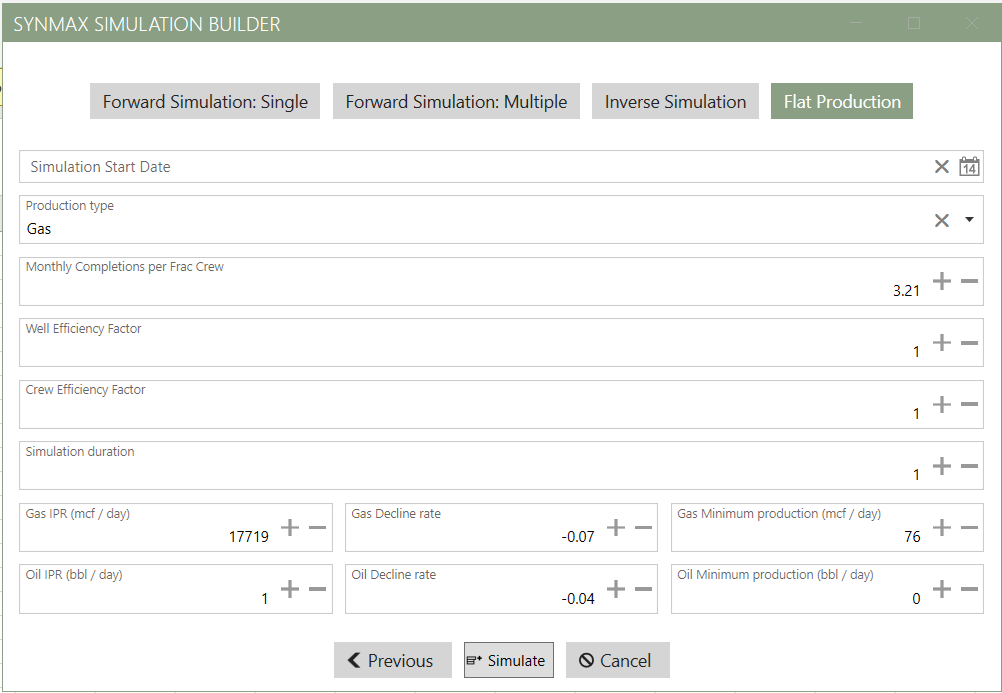
Open Simulation Builder and select Flat Production.
Enter the fields shown on screen (see the “Input fields” table below).
Specify the Production type to generate.
Click Simulate.
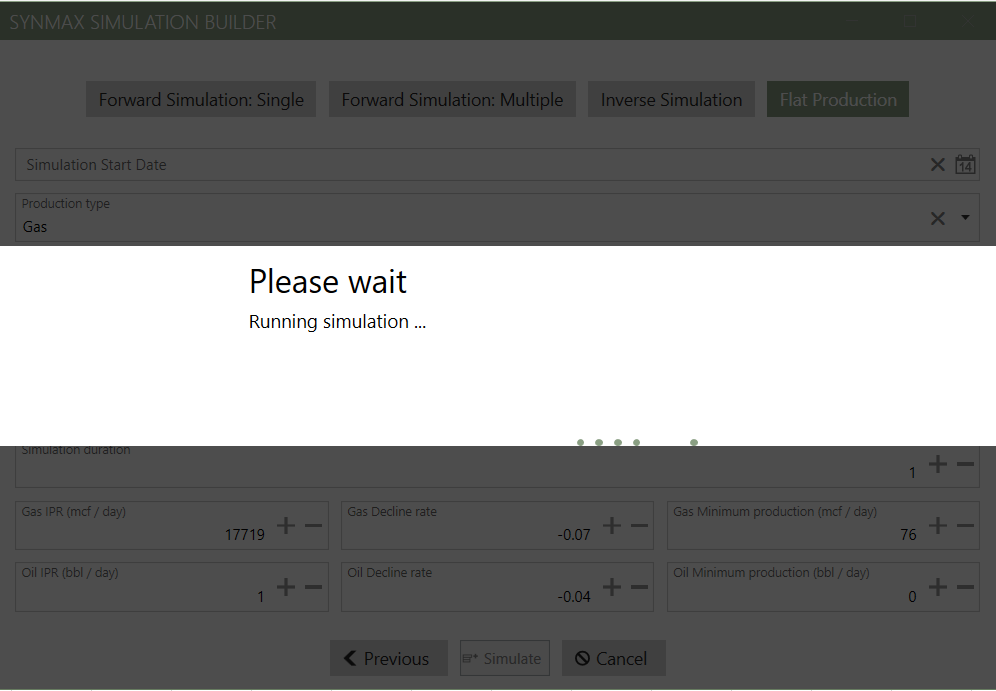
A Please wait screen appears while the model queries history, prepares parameters, and connects to the Production Studio API.
When the run finishes, you will see a message as Simulation completed successfully.
The builder automatically generates an Excel worksheet with all inputs and results.
Input fields (Flat Production)#
The table below lists the input fields required.
Field |
What it means / how it’s used |
Sample value |
|---|---|---|
Region |
The main geographic region for the simulation. |
northeast |
Subregion |
The specific subregion or state within the selected region. |
OH |
State Code |
Letter code representing the state. |
OH |
County |
County name within the selected state. |
HOLMES |
Operator |
The operating company or entity managing the wells. |
ANGUS ENERGY LLC |
End Date |
The end date for the simulation time frame. |
10/29/2025 |
Simulation Start Date |
The date the forecast begins. |
6/2/2024 |
Production type |
Select what values in future production refer to eg:- Gas, Oil |
Oil |
Monthly Completions per Frac Crew |
Scalar used to convert between number of completions and number of frac crews. |
3.09 |
Well Efficiency Factor |
Scalar used to increase/decrease the IP rate of wells each year. Only applicable if simulation length is longer than 12 months. |
1 |
Crew Efficiency Factor |
Scalar used to increase/decrease the Monthly Completions per Frac Crew. Only applicable if simulation length is longer than 12 months. |
1 |
Simulation duration |
The total length of time (in months) that the simulation will run. |
1 |
Gas IPR (mcf/day) |
Initial production rate of gas in the production profile (mcf/day) |
7613 |
Gas Decline rate |
Exponential decay rate applied to the gas production profile |
-0.03 |
Gas Minimum production (mcf/day) |
Y-intercept applied to the gas production profile such that gas production never drops below this point |
0 |
Oil IPR (bbl/day) |
Initial production rate of oil in the production profile (bbl/day) |
186 |
Oil Decline rate |
Exponential decay rate applied to the oil production profile |
-0.06 |
Oil Minimum production (bbl/day) |
Y-intercept applied to the oil production profile such that oil production never drops below this point |
0 |
Viewing the Excel output#
The simulation generates a new Excel worksheet and writes results to the new worksheet in your workbook.
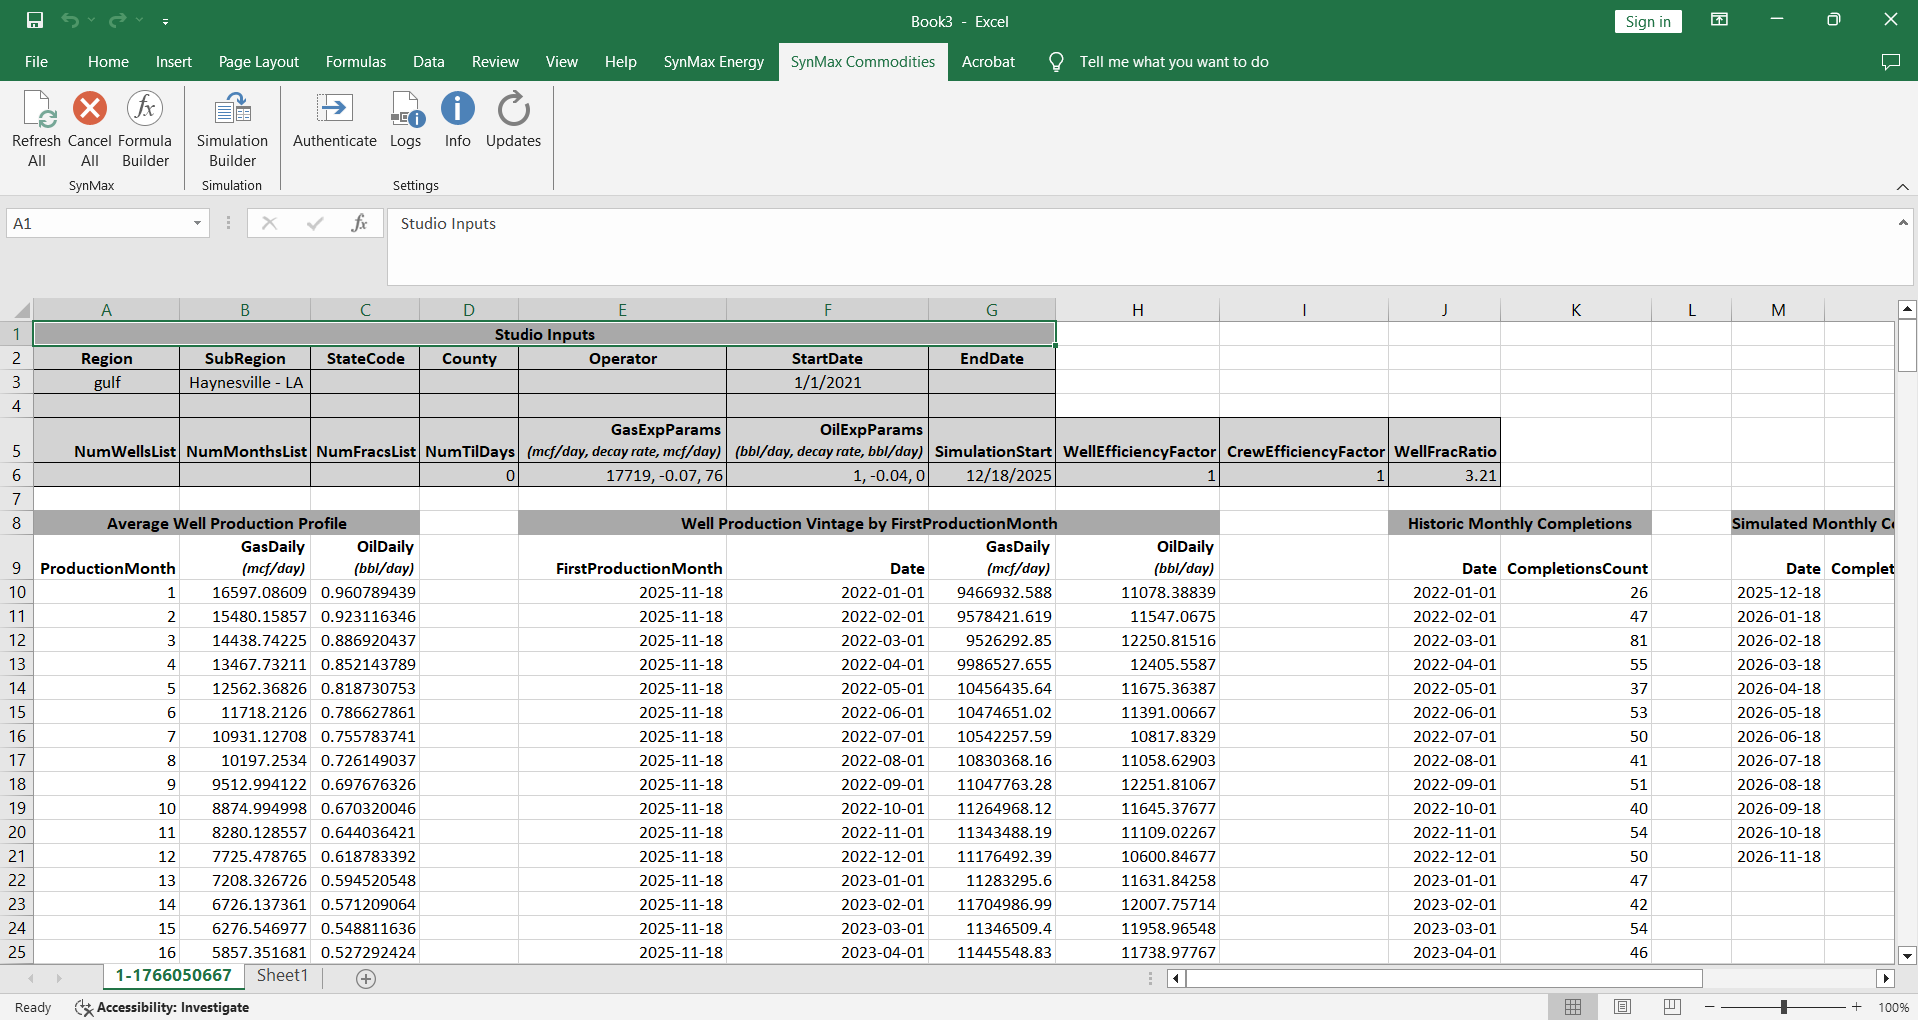
Sample Output#
The model generates an Excel sheet with your simulation results. Below is a shortened example from Flat Production showing the exact columns produced. (Only a few rows are shown for readability; your sheet will include many more.)
Studio Inputs#
Region |
SubRegion |
StateCode |
County |
Operator |
StartDate |
EndDate |
|---|---|---|---|---|---|---|
gulf |
Haynesville - LA |
1/1/2021 |
NumWellsList |
NumMonthsList |
NumFracsList |
NumTilDays |
GasExpParams (mcf/day, decay rate, mcf/day) |
OilExpParams (bbl/day, decay rate, bbl/day) |
SimulationStart |
WellEfficiencyFactor |
CrewEfficiencyFactor |
WellFracRatio |
|---|---|---|---|---|---|---|---|---|---|
0 |
17719, -0.07, 76 |
1, -0.04, 0 |
12/18/2025 |
1 |
1 |
3.21 |
Average Well Production Profile, Well Production Vintage by FirstProductionMonth, Historic Monthly Completions, Simulated Monthly Completions, Historic Average Daily Frac Crews, Simulated Average Daily Frac Crews#
Average Well Production Profile
ProductionMonth |
GasDaily (mcf/day) |
OilDaily (bbl/day) |
|---|---|---|
1 |
16597.08609 |
0.960789439 |
2 |
15480.15857 |
0.923116346 |
3 |
14438.74225 |
0.886920437 |
Well Production Vintage by FirstProductionMonth This table allows the user to make a wedge chart if grouping by Vintage where each wedge represents the amount of the total production contributed by each vintage.
FirstProductionMonth |
Date |
GasDaily (mcf/day) |
OilDaily (bbl/day) |
|---|---|---|---|
2025-11-18 |
2022-01-01 |
9466932.588 |
11078.38839 |
2025-11-18 |
2022-02-01 |
9578421.619 |
11547.0675 |
2025-11-18 |
2022-03-01 |
9526292.85 |
12250.81516 |
Historic Monthly Completions
Date |
CompletionsCount |
|---|---|
2022-01-01 |
26 |
2022-02-01 |
47 |
2022-03-01 |
81 |
Simulated Monthly Completions
Date |
CompletionsCount |
|---|---|
2025-12-18 |
575 |
Historic Average Daily Frac Crews This table provides the historical data with Sum of active frac crews every day in a month divided by the number of days in the month.
Date |
FracCrewsCount |
|---|---|
2021-01-01 |
7.870967742 |
2021-02-01 |
8.821428571 |
2021-03-01 |
11.03225806 |
Simulated Average Daily Frac Crews This table provides the simulated data with Sum of active frac crews every day in a month divided by the number of days in the month.
Date |
FracCrewsCount |
|---|---|
2025-12-18 |
179.1277259 |
Note
The Excel sheet contains many additional rows (months) that are not shown here for brevity.
Output field explanations (Inverse Simulation)#
Use this table to interpret the columns in the Excel output.
Column / Section |
Meaning |
|---|---|
Region, SubRegion, StateCode, County, Operator, StartDate, EndDate |
Context for the area/operator used to build the forecast. |
NumWellsList |
Number of completed wells each month, each element in list represents one month. |
NumMonthsList |
Number of months simulated (for this mode, a single value is stored). |
NumFracsList |
Number of active frac crews each month, each element in list represents one month. |
GasExpParams (mcf/day,decay rate,mcf/day) |
IP Rate, decline rate, and minimum production for exponential gas production profile passed as an array. |
OilExpParams (bbl/day,decay rate,bbl/day) |
IP Rate, decline rate, and minimum production for exponential oil production profile passed as an array |
SimulationStart |
The simulation start date you entered. |
WellEfficiencyFactor |
Efficiency multiplier applied to well performance. |
CrewEfficiencyFactor |
Efficiency multiplier applied to frac crew productivity. |
WellFracRatio |
Ratio of wells to frac crews. |
ProductionMonth |
Number of months the well has been producing at a given point in time. |
GasDaily(mcf/day) |
Gas production amount in MCF per day. |
OilDaily(bbl/day) |
Oil Production amount in BBL per day. |
FirstProductionMonth |
First month that a well started producing, production results aggregated up by this field in results. |
Date (Vintage) |
Date for each historical vintage cohort used to compute production by first production month. |
GasDaily (Vintage,mcf/day), OilDaily (Vintage,bbl/day) |
Modeled totals by vintage for the cohort starting in Date (Vintage). |
Date (HistComp) |
Month of historic completions. |
CompletionsCount (Hist) |
Total number of well completions by month in results (History). |
Date (SimComp) |
Date of simulated completions from your inputs. |
CompletionsCount (Sim) |
Total number of well completions by month in results (Simulated). |
Date (HistFrac) |
Date of historic average daily frac crews. |
FracCrewsCount (Hist) |
Total number of active frac crews by month in results (History). |
Date (SimFrac) |
Date of simulated average daily frac crews. |
FracCrewsCount (Sim) |
Total number of active frac crews by month in results (Simulated) |