Usage 2.0.0#
Understanding the Basics#
With this version of the SynMax Excel Add-in, users can now insert and run formulas in two ways:
Option 1: via the Formula Builder UI - a user-friendly interface available from the SynMax Energy or SynMax Commodities tab.
Note
The Formula Builder is available under SynMax Energy or SynMax Commodities depending on your add-in version:
Use SynMax Energy if your add-in version is earlier than 2.0.0.0.
Use SynMax Commodities if your add-in version is 2.0.0.0 or higher.
Option 2: via the Excel “Insert Function” dialog selecting a SMX category.
Both options produce identical results. You may use whichever method best fits your workflow.
We recommend using the new Formula Builder method as it is faster, easier, and more user-friendly, especially for new users.
Option 1: Via the Formula Builder UI#
The Formula Builder provides an easy and interactive way to insert SynMax functions into Excel without manually typing formulas.
Open Excel and see whether the SynMax Add-in is loaded. You’ll see either the SynMax Energy or SynMax Commodities tab on the ribbon, depending on your installed version.

Click the Formula Builder button to open the tool.

In the Formula Builder window, select either Hyperion 4.0 or Vulcan 2.0.

Select the function you prefer to insert from the drop down. Fill in the required other parameters and click Insert to execute the selected function.

The formula will run and the results will appear in a new worksheet generated automatically.
Note
In the Formula Builder you can switch between Hyperion and Vulcan products based on your preference. Each output sheet is created independently and can be refreshed, and modified later later.
Option 2: Via Excel “Insert Function” (Legacy Method)#
You can still run SynMax functions using Excel’s built-in Insert Function dialog. This method behaves exactly like earlier versions of the add-in.
Open Excel and create a new workbook or open an existing one.

Click on the Formulas tab in the ribbon menu.

Click on the Insert Function button.

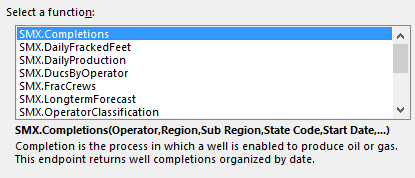
In the Or select a category section, scroll down and choose one of the available SMX categories based on the data source you wish to use:
SMX - Original category used for legacy functions.
SMXV2 - Functions from the Vulcan 2.0.
SMXH4 - Functions from the Hyperion 4.0.

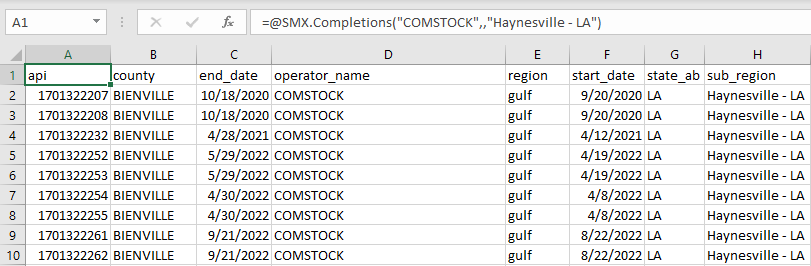
Select the function you want to use from the list (for example, SMX.Completions).
Click OK to open the Function Arguments dialog box.

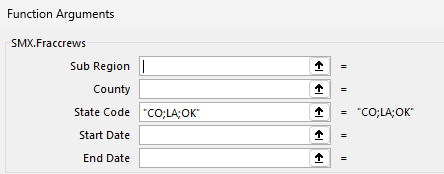
In the dialog box, enter the required argument values in the Value column.
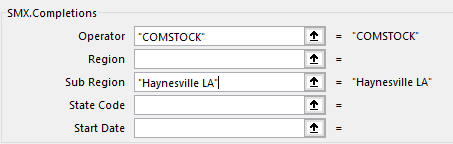
To specify multiple values, separate them with a semicolon (“;”).
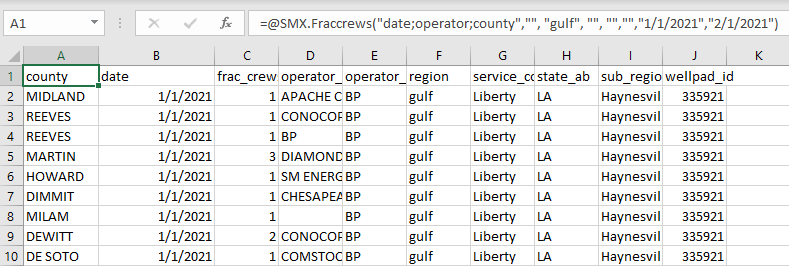
Click OK to close the dialog and insert the formula into your worksheet.
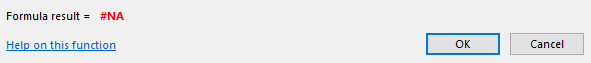
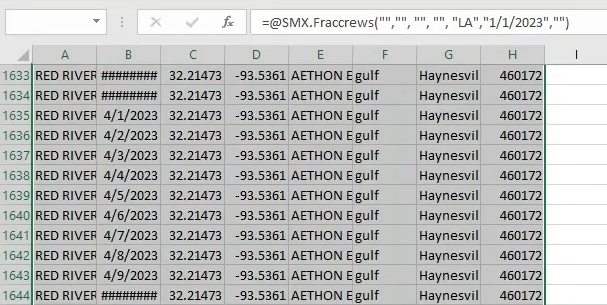
The results will appear directly in your selected cell.
Creating PivotTables#
Select the data you want to display as a PivotTable. To select all rows and columns in the sheet, press ctrl + a.
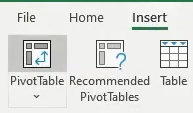
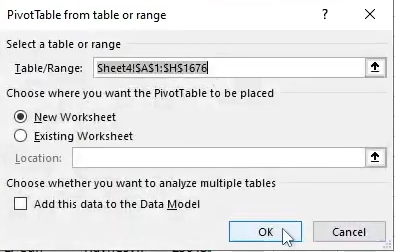
Under the Insert menu in the ribbon, click PivotTable.
Click OK to create a PivotTable with default settings.
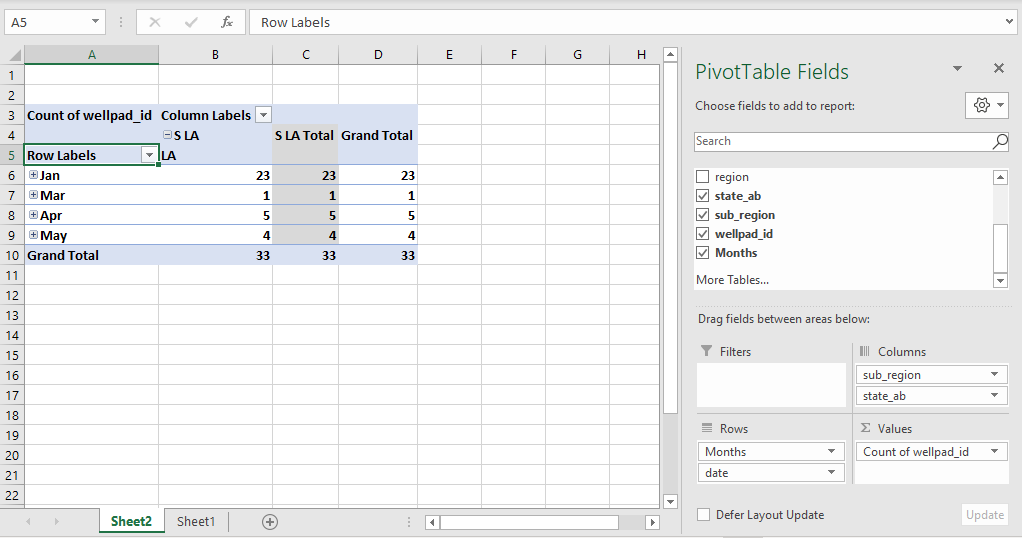
Use the PivotTable Fields pane to add or remove fields in Rows, Columns, Filters, and Values.
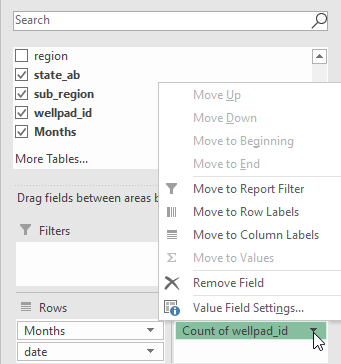
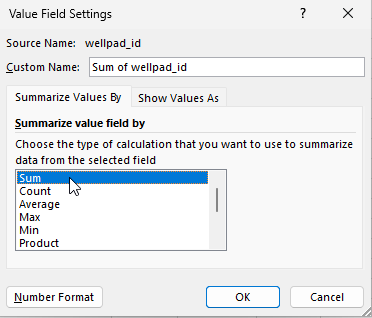
Click the arrow next to a field name and choose Value Field Settings to change the aggregation type.
Note
To learn more about PivotTables, visit the Microsoft 365 support page.
Creating Charts#
In the PivotTable you just created, ungroup the data you want to visualize.
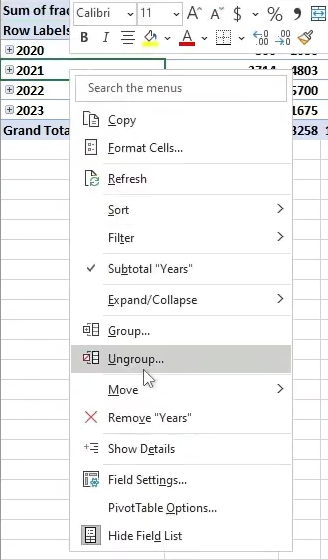
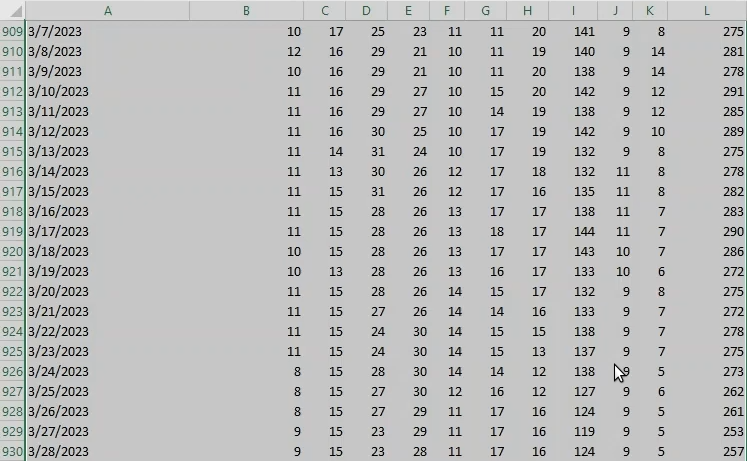
Select the data.
Under the Insert tab in the ribbon, click on your preferred chart type. Hover over icons to preview.
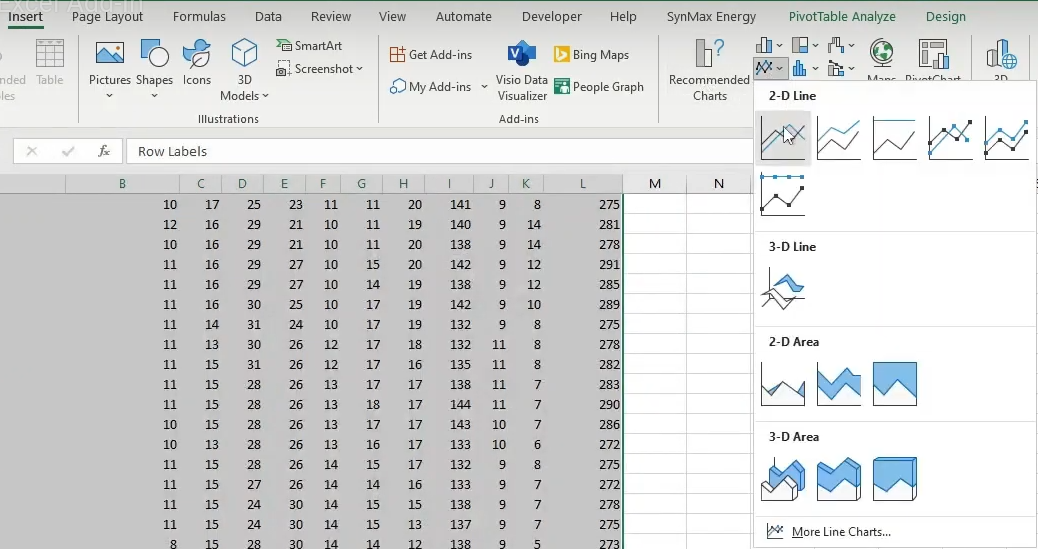
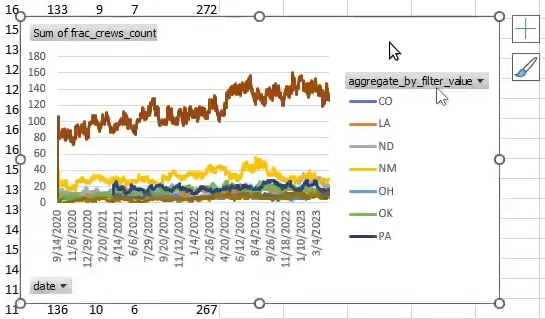
Example: a simple 2-D line plot.
Note
To learn more about charts, please see the Microsoft 365 support page.
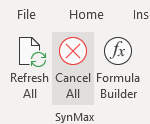
Advanced Features#
Refresh All: Runs the last used formula again.
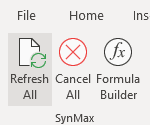
Cancel All: Cancel any running requests or calculations in the workbook. This is useful if you notice an error in your data or formulas and want to stop the calculation process to avoid incorrect results or unnecessary processing time.
Using Aggregation#
The Aggregate By column in the Formula Builder acts as a pivoting tool that groups data based on one or more parameters.